We have all been there. You are staring at a to-do list that is three days overdue, wondering why you even bothered with the latest productivity app. Sometimes, checking off boxes just is not enough to satisfy that itch to actually create something tangible. If you are tired of the digital equivalent of pushing papers, it is time to shift gears. Instead of just managing your time, why not manage some data? Specifically, let us talk about the elements. Today, we are going to walk through how to build your very own real-time weather dashboard using the OpenWeatherMap API. This is not just a coding exercise; it is a gateway into the world of real-world technology and innovation.
The Fascination with Weather Data
Why weather? It sounds a bit like small talk at a grocery store, but weather is actually one of the most complex and fascinating data sets available to the public. It affects everything from what we wear to how we feel and even how global economies function. For a developer or a tech enthusiast, weather data provides the perfect playground for learning how APIs (Application Programming Interfaces) work. By building a dashboard, you are moving beyond static lists and entering the realm of dynamic, living applications that change based on what is happening outside your window right now.

When you start this journey, you are not just learning to code; you are learning to curate information. We live in an age of information overload, and being able to pull exactly what you need – like wind speed, humidity, or the exact moment of sunset – is a superpower. If you are looking for more ways to sharpen your digital skills, you should check out the latest tech guides over at Beemytech to keep the momentum going.
Your Tech Stack: What You Need to Get Started
Before we dive into the code, let us look at the tools we need. You do not need a supercomputer or a degree in meteorology to do this. For this guide, we will focus on using Python because it is incredibly readable and has some fantastic libraries for handling web requests. However, the logic we are discussing can easily be applied to JavaScript if you prefer building for the browser.
The Essential Tools
- Python: The backbone of our project. It is friendly for beginners but powerful enough for the pros.
- OpenWeatherMap API Key: This is your ticket to the data. You can get a free one by signing up at the OpenWeatherMap official site.
- Requests Library: This allows Python to talk to the internet.
- Visual Studio Code: Or any text editor of your choice. I highly recommend VS Code for its excellent extensions.
Setting up your environment is half the battle. Once you have Python installed and your API key in hand, you are already ahead of 90 percent of people who just talk about coding but never actually start.
Step One: Securing the Data
The first real step in innovation is understanding your source. OpenWeatherMap provides data in a format called JSON (JavaScript Object Notation). Think of JSON as a very organized grocery list where every item has a label. When we ask the API for the weather in London, it sends back a big block of text that tells us the temperature, the pressure, the cloud cover, and more.
To get this data, we use a URL. It looks like a standard web address, but it contains our API key and our search parameters. It is like sending a scout out to find information and having them report back to you. The beauty of this is that the data is live. If a storm rolls in while you are testing your code, your dashboard will reflect that immediately. That is the difference between a static app and a real-time dashboard.
Step Two: Writing the Code
Let us look at the logic. First, we import the requests library. Then, we define a function that takes a city name and plugs it into our URL. We tell Python to go to that URL, grab the data, and bring it back. Once we have that data, we need to parse it. This is where the magic happens. We pick out the specific pieces we want: the temperature (usually in Kelvin, so we convert it to Celsius or Fahrenheit) and the weather description.
A Quick Logic Breakdown
In your code, you will want to handle errors. What if the user types in a city that does not exist? A good developer always assumes the user might make a mistake. By using a simple try-except block, you can make your dashboard robust. Instead of the program crashing, it can politely tell the user, “Hey, I couldn’t find that city. Maybe check the spelling?” This kind of attention to detail is what separates great software from frustrating tools.

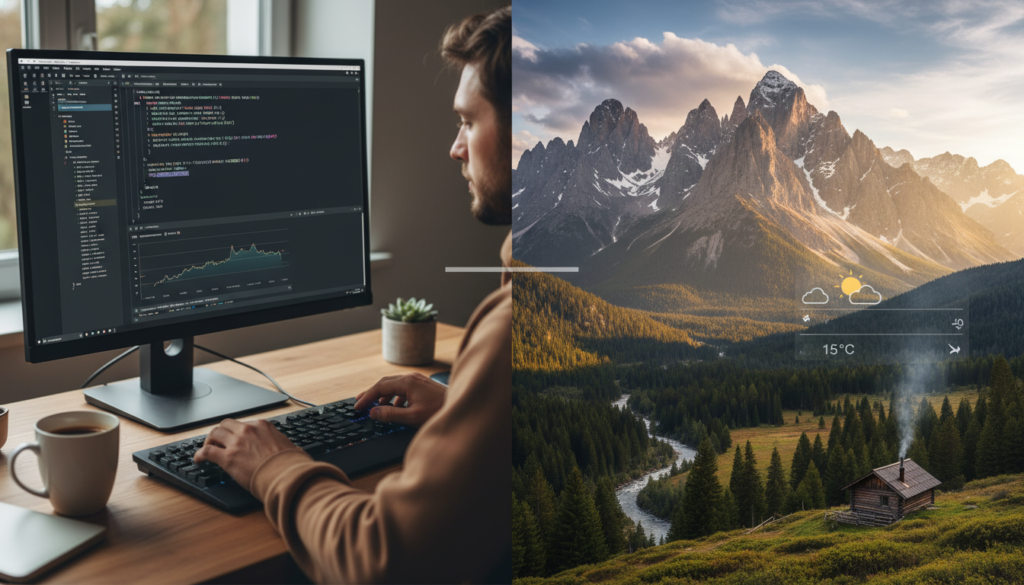
Step Three: Making It Look Good
Functionality is vital, but presentation is where your innovation truly shines. If you are building this as a web app, you can use HTML and CSS to create a beautiful interface. Imagine a background that changes color based on the temperature: cool blues for a chilly morning and warm oranges for a sunny afternoon. You could even add icons that match the current conditions, like a little sun or a raindrop.
If you are sticking to the terminal for now, you can still use libraries like Colorama to make your text pop. There is something deeply satisfying about seeing a bright green “Current Temperature: 75°F” appear in a black terminal window. It feels like you have built a command center for your own life.
The Path of Innovation: Going Beyond
Once you have the basic dashboard working, don’t stop there. This is where the “Beyond the To-Do List” part of the title really kicks in. What else can you do with this data? Here are a few ideas to spark your creativity:
- Notification System: Set up an alert that texts you if the forecast calls for rain, so you never forget your umbrella again.
- Historical Tracking: Save the daily high and low temperatures to a CSV file and create your own climate chart over a month.
- Smart Home Integration: If you are feeling really adventurous, connect your weather dashboard to your smart thermostat. If the outside temperature drops below a certain point, have your heater kick in automatically.
Innovation isn’t always about inventing something entirely new; often, it is about combining existing tools in a way that makes your life easier or more interesting.
Conclusion: The Joy of Building
Building a weather dashboard is more than just a weekend project. It is a reminder that the tools of creation are right at your fingertips. We spend so much time consuming content and managing tasks that we often forget the pure joy of making something from scratch. By using OpenWeatherMap and a little bit of code, you have bridged the gap between the digital world and the physical world.
So, the next time you find yourself stuck in a loop of endless to-do lists, take a break. Build something that talks to the clouds. Whether you are a seasoned pro or a curious beginner, the satisfaction of seeing your own code report the real-time movement of the world is hard to beat. Now, go forth and code – the forecast looks bright!